

ROI Dashboard for Company Insights
Discover illuminating benefits your MangoApps domain provides, such as how much money it saves your company per month and how many hours it gives back to your employees, then quantify where those savings are or how they can be reinvested. Uncover useful metrics necessary for calculating your domain’s ROI, and realize its positive impact on productivity throughout your organization.

User Engagement Monitoring
Get a breakdown based on the different levels of engagement among your employees every month to spot patterns and make comparisons. Use this information to build best practices based on power users, encouraging greater adoption and moving employee engagement to the next level.

User Adoption Dashboard
Access and explore domain user insights. Learn which department utilizes your MangoApps domain most, where your most active users are logging in from, what their preferred method of access is, and more. Apply the data found to pinpoint ways to improve your domain’s adoption levels across all teams and devices.
There’s an absolute return on investment with MangoApps as our partner. We’ve been able to actualize our vision to make community participation and employee engagement happen.

Dr. Kevin Klauer
Chief Medical Officer
Team Health

Content Creation Data
Uncover metrics regarding your content’s performance, such as the number of views, likes, and comments each publication receives. By monitoring the engagement and popularity of new content introduced to your network, you’ll understand when users are most active and what types of content resonate with them most. With this information, strategically plan scheduled content you know will garner favorable responses and higher engagement.

Google Analytics Integration
While Google Analytics is often used to understand the behavior of users on marketing sites, it can also be used to unveil how internal users and employees navigate and use your domain. Identify how many views each page gets, how much time users spend on a specific page, or how often certain pages are visited.
User Activity Tracking
Admins can observe your users’ login activity within the last 90 days, giving intranet managers an inside look at daily login numbers, unique logins, and new users visiting your domain. Download the report for in-depth details regarding what type of device and operating systems your users access your site from.
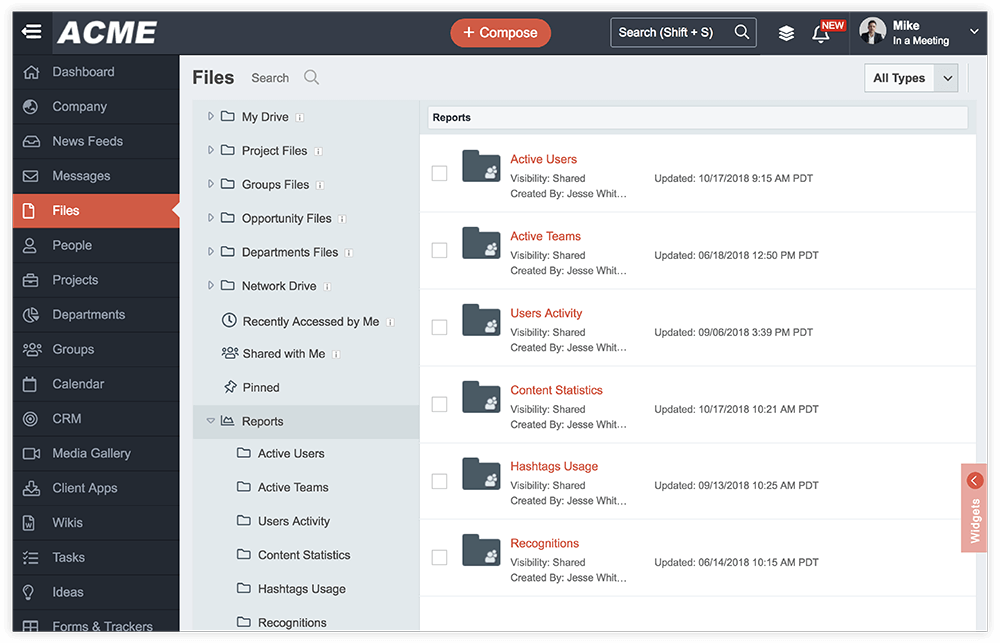
Secure Access Anytime
Generated reports are stored safely and require special permissions to access. Admins control who has access to the information and can easily view, download and share the reports at any time both inside and outside of MangoApps.
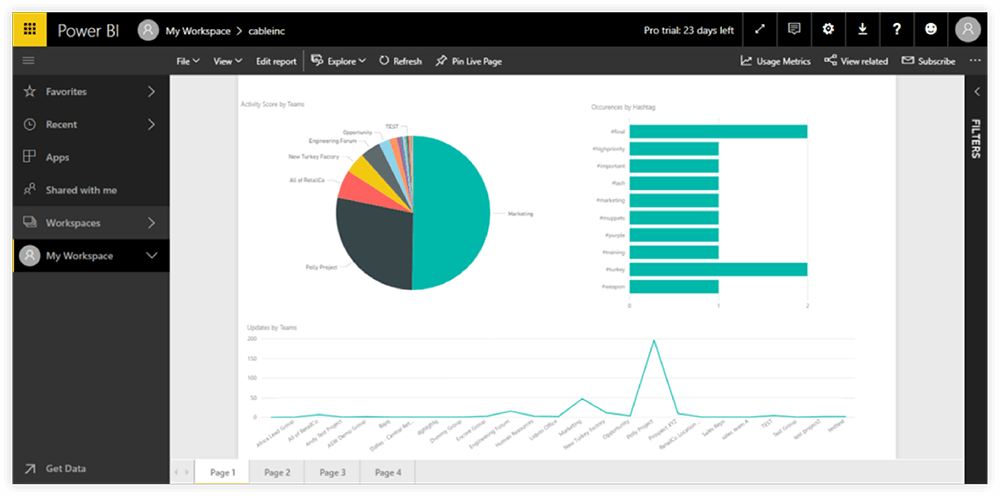
Power BI Integration
MangoApps offers admins optional integration with Microsoft Power BI business analytics tools. This seamless integration provides admins with descriptive, visual and interactive data designed with self-service business intelligence capabilities.
Book a meeting!
For 15+ years, we've perfected our product, earning the trust of 1 million+ users and an NPS of 78.
Why Choose Us?
- Superior Product: 15+ years of R&D
- Top Security: HITRUST, ISO & SOC 2 certified.
- Exceptional UX: Delightful on mobile and desktop.
Trusted by Legendary Companies:
