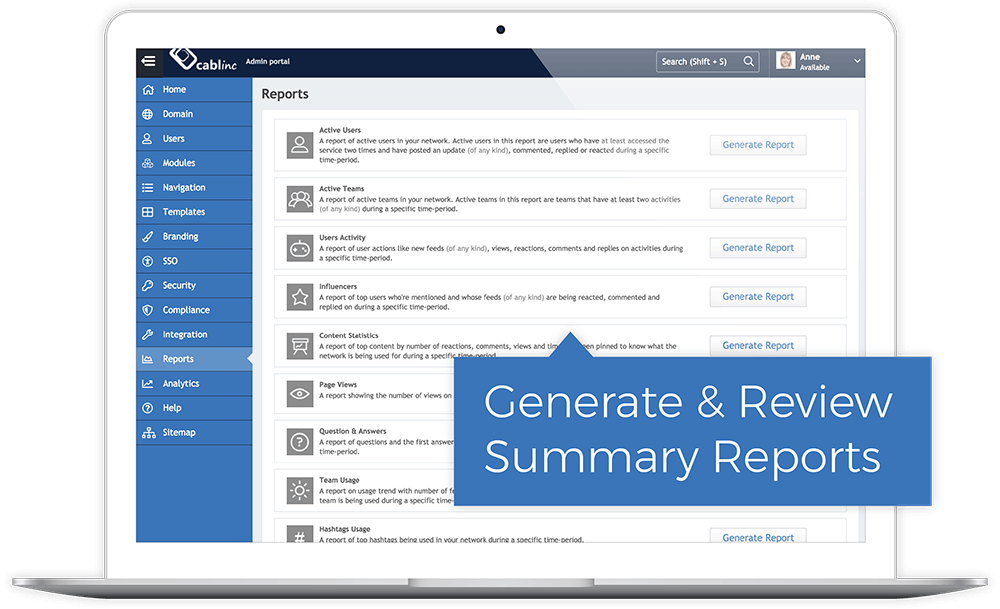
Comprehensive Usage Reports

MangoApps Usage Reports and BI give admins detailed information and in-depth data about how employees are using MangoApps, helping them create effective content and helping employees achieve long term success.

  • Generate comprehensive user reports detailing active user summaries, user activity, hashtag usage, internal influences, and more.
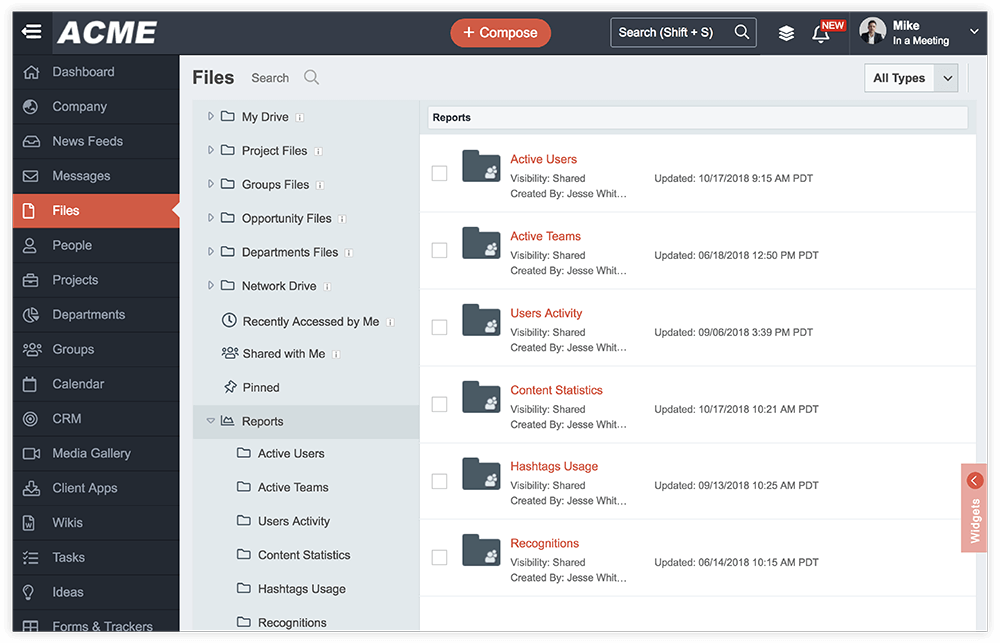
  • Safely view, share, and store reports in a confidential access area available only to domain administrators and approved guests.
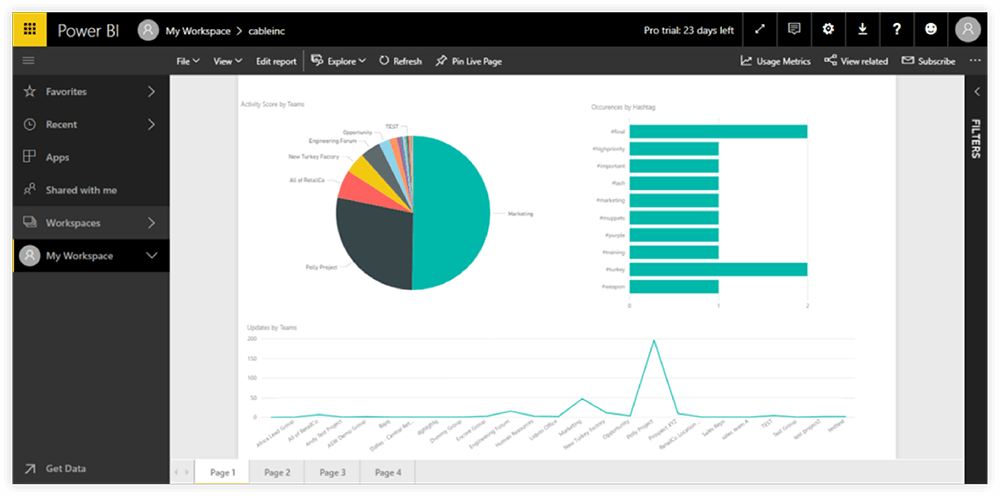
  • Seamlessly integrate with Microsoft Power BI to access descriptive, visual, and interactive business analytics information.
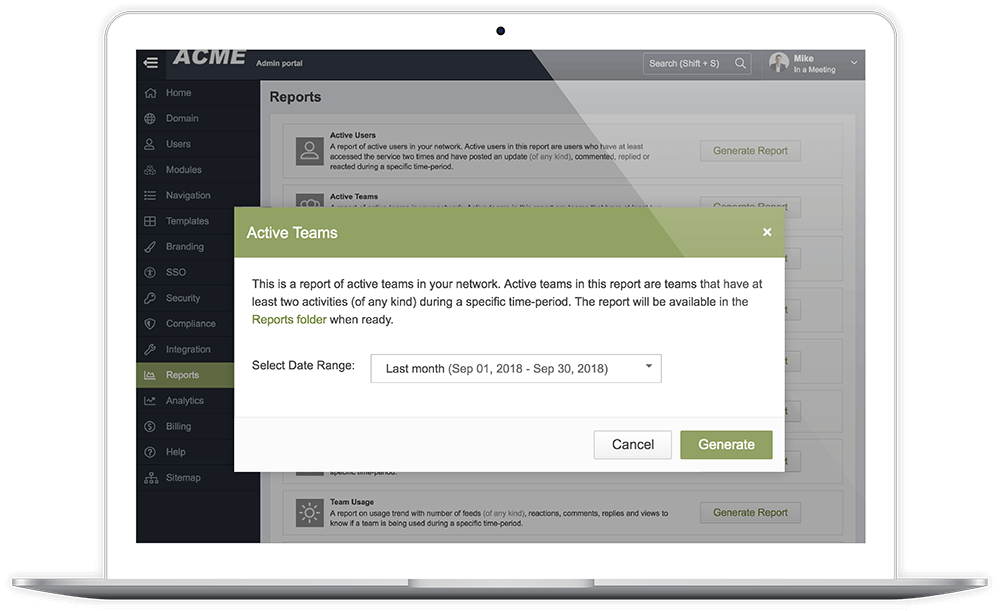
  • Create team specific reports and receive deeper insights into team data, content statistics, team usage trends and page view info.
Laptop screen displaying an admin portal with a sidebar menu and a Reports section listing options like Active Users, Active Teams, and Content Statistics with Generate Report buttons. A blue label reads 'Generate & Review Summary Reports.'

Insightful and Useful Reports

Domain admins can generate detailed usage reports to help them understand and view data and monitor user activity. Some of these reports include active user summaries, user activity, hashtag usage and data and information about internal influencers.

Secure Access Anytime

Generated reports are stored safely and require special permissions to access. Admins control who has access to the information and can easily view, download and share the reports at any time both inside and outside of MangoApps.

User interface of ACME file management system showing sidebar menu and reports list with folders like Active Users, Active Teams, and Users Activity.
Power BI dashboard showing a pie chart of activity scores by teams, a bar chart of occurrences by hashtag, and a line graph of updates by teams.

Power BI Integration

MangoApps offers admins optional integration with Microsoft Power BI business analytics tools. This seamless integration provides admins with descriptive, visual and interactive data designed with self-service business intelligence capabilities.

Team-Level Analysis

Admins can also generate team specific reports to receive deeper insights about their specific groups, teams, and projects. These reports include active team data, content statistics, question and answer details, team usage trends and page view info.

Laptop screen showing ACME admin portal with an Active Teams report dialog describing the report and options to select date range, cancel, or generate the report.
By submitting this form, you agree to MangoApp’s Privacy Policy.
Thank you! Your submission has been received!
Oops! Something went wrong while submitting the form.

Book a Meeting!

For 15+ years, we've perfected our product, earning the trust of 1 million+ users and an NPS of 78.

Why Choose Us?

  • Superior Product: 15 years of R&D
  • Top Security: HITRUST, ISO &  SOC 2 certified.
  • Exceptional UX: Delightful on mobile and desktop.

Trusted by Legendary Companies:

Grid of six company logos with employee and associate numbers: AutoZone with 125,000 employees and 7,000+ stores; PetSmart with 50,000+ associates; Alorica with 100,000+ employees; AS Watson with 125,000+ employees and 16,100+ stores; YMCA with 50,000+ employees; TEAMHealth with 25,000+ employees.